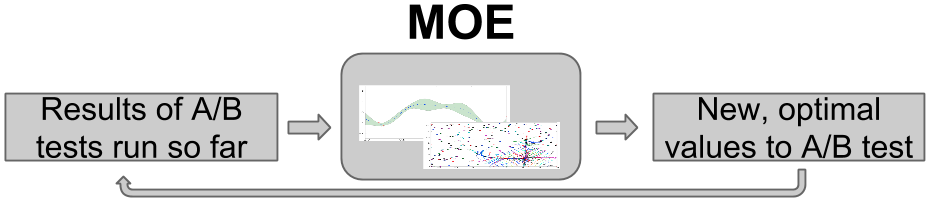
How does MOE work?
Steps toward optimization:
- Build a Gaussian Process (GP) with the historical data
- Optimize the hyperparameters of the Gaussian Process
- Find the point(s) of highest Expected Improvement (EI)
- Return the point(s) to sample, then repeat
This section has been given as a 15 minute talk with slides as well.
This section will use examples generated from the Demo Tutorial included with MOE.
Build a Gaussian Process (GP) with the historical data
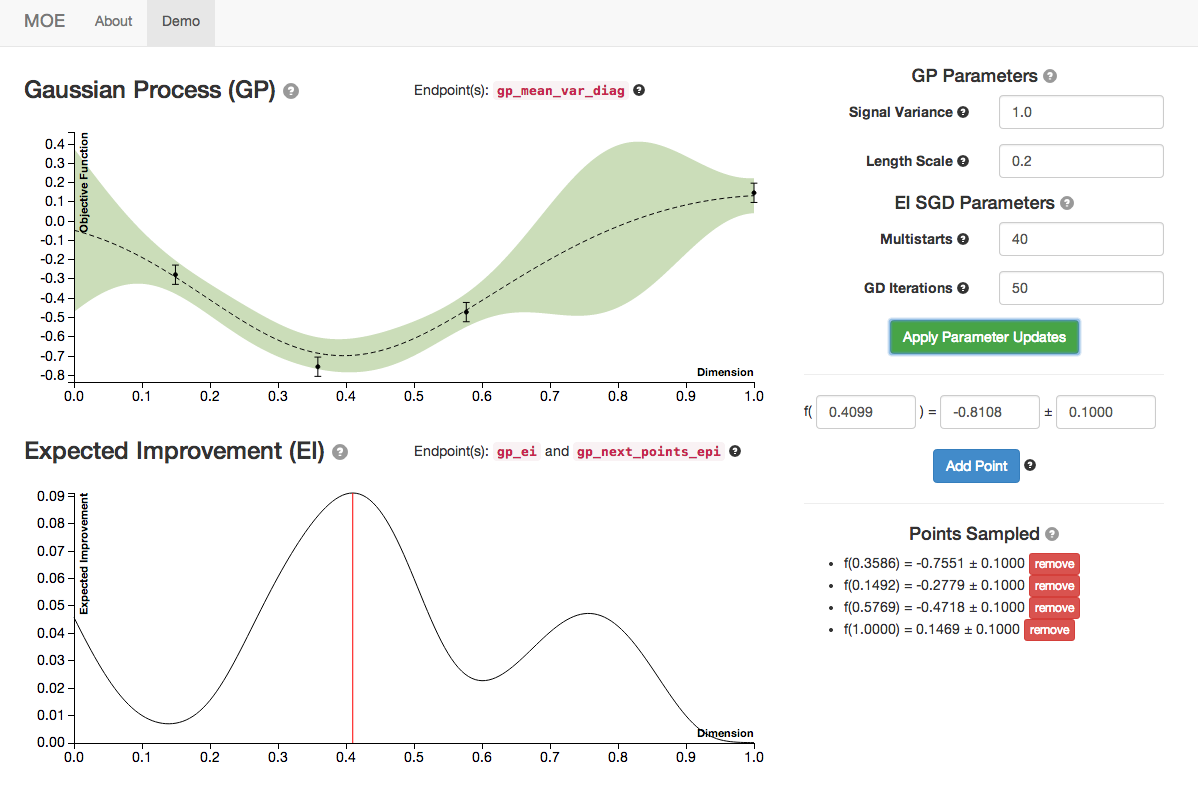
The GP evolves as it is given more historical data, making a better and better model of the underlying function.
See:
Optimize the hyperparameters of the Gaussian Process
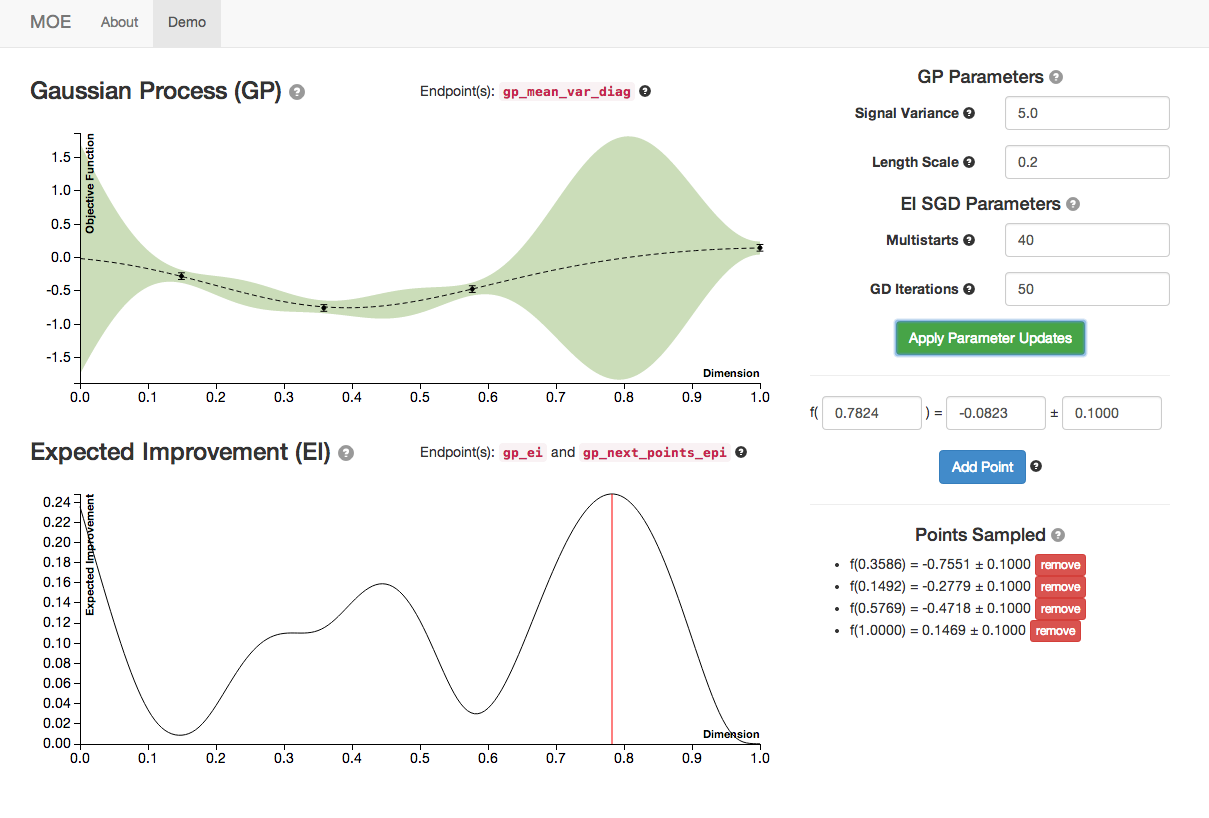
This plot has the same historical data as the plot above. By optimizing the hyperparameters of the GP we select the best model of our underlying function (with respect to a choice of likelihood functions).
See:
Find the point(s) of highest Expected Improvement (EI)
MOE suggests the points of highest Expected Improvement be sampled next. These are the points that are expected to beat the current best sampled point by the most.
See:
Return the point(s) to sample, then repeat
By continuing to optimize over many iterations, MOE quickly finds approximate optima, or points with large CTR. As the world changes over time, MOE can surf these shifting optima as they move, staying at the peak of the potentially changing objective function in parameter space as time advances.
For more examples on how MOE can be used see Examples, or see Why Do We Need MOE? for information about how MOE is useful for these kinds of problems and some alternate methods.